Configure Application Insights
Application Insights is used for development and as a production monitoring solution. It works by installing a package into your app, which can provide a more internal view of what’s going on with your code. Its data includes response times of dependencies, exception traces, debug- ging snapshots, and execution profiles. It provides powerful smart tools for analyzing all this telemetry both to help you debug an app and to help you understand what users are doing with it. You can tell whether a spike in response times is caused by something in an app or an external resourcing issue. Application Insights provides significantly more value when your application is instrumented to emit custom events and exception information.
To create an Application Insights resource, open Azure Monitor, click Applications on the left (under Insights), and then click Create Application Insight Apps, as shown in Figure 5-33.
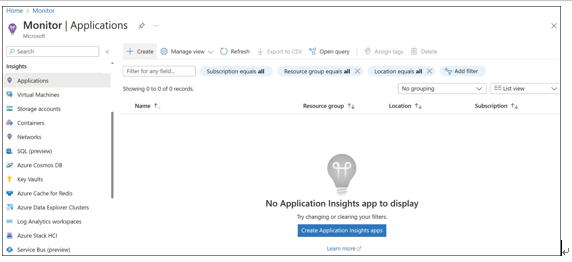
FIGURE 5-33 Create Application Insights apps
On the Basics tab, select the subscription, resource group, region, resource mode, and Log Analytics workspace and specify the name (see Figure 5-34).
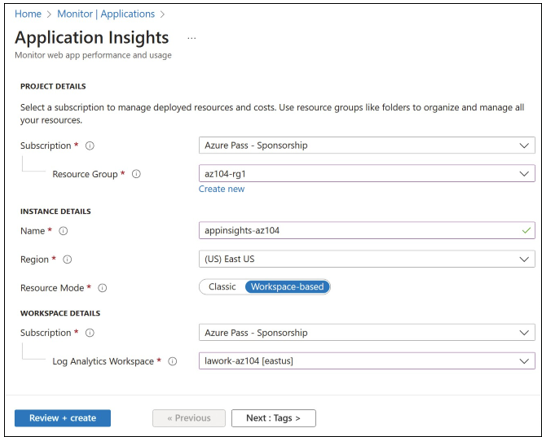
FIGURE 5-34 Basics tab of the Application Insights blade
Application Insights provides an extensive dashboard depicting all the aspects of your application workload, as shown in Figure 5-35. The dashboard displays application performance, usage, diagnostic, and other app data. The dashboard can be customized based on your preferences.
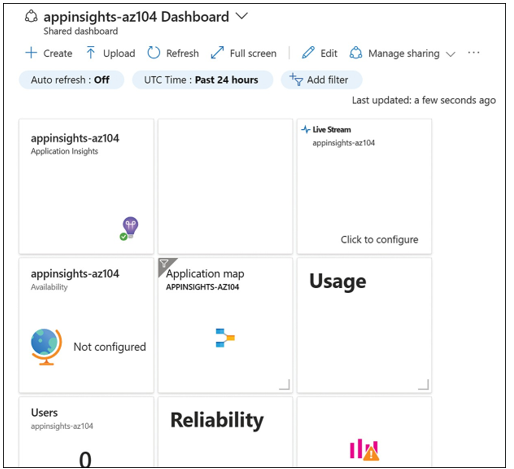
FIGURE 5-35 Application Insights dashboard
The suite of Azure Monitor features includes Insights. As of this writing, there are more than 20 service types that offer different insights, including compute, storage, networking, databases, and more.
VM insights
VM insights helps to monitor the performance and health of your VMs and VM scale sets. The insights and data gathered can then help you troubleshoot issues, see trends across logs and metrics, and create alerts. To configure VM insights from the Azure portal, search for Monitor. On the Monitor blade, under Insights, click Virtual Machines. The VM insights dashboard is displayed in Figure 5-36.
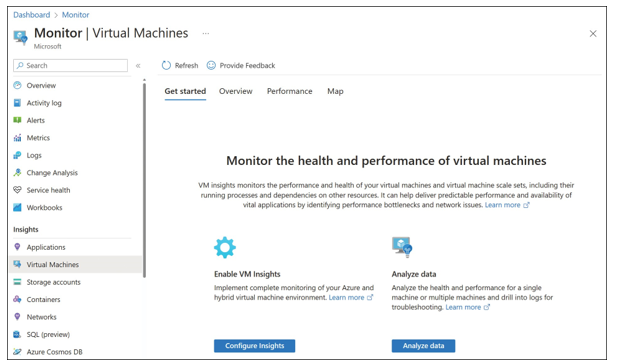
FIGURE 5-36 VM insights
On the VM Insights dashboard, click Configure Insights, or click the Overview tab. If you have previously enabled Data Collection Rules or other Monitor features, your VMs might already be monitored. If not, they will appear on the Not Monitored tab. Figure 3-37 displays the VM insights overview on the Monitored tab.
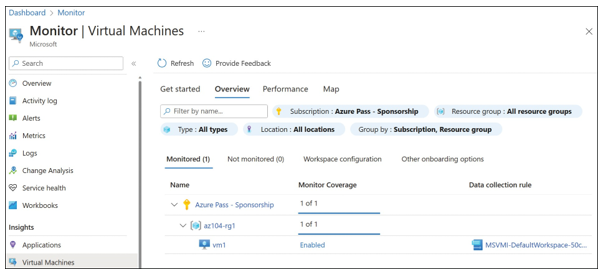
FIGURE 5-37 VM insights overview
The Performance tab of VM insights displays some of the top charts for the VMs. This includes CPU utilization, available memory, bytes sent and received, and logical disk space used percentage. Figure 5-38 displays a portion of the Performance tab.
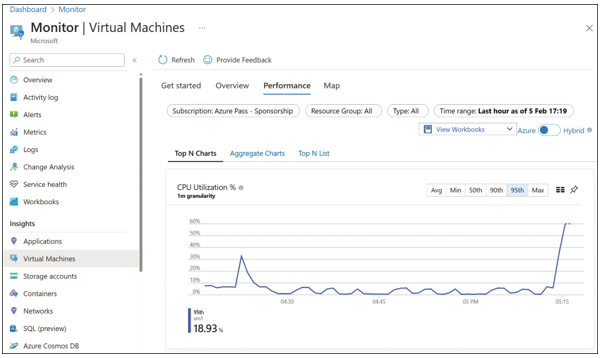
FIGURE 5-38 VM insights performance