At first look, the observability services don’t appear to be the most critical topic. It is possible to run workloads without monitoring them. But soon, after you start deploying services at scale, you will look for a monitoring service to optimize or plan the usage of Google Cloud resources. You will want to investigate logs once the first issues appear. Then, you will need to build customized dashboards and alerts to get notified of the status of your services.
This chapter will help you better understand what kind of observability tools Google Cloud offers and how to use them for your workloads.
We will focus on Google Cloud’s operations suite (formerly Stackdriver), which consists of the following fully managed services – Cloud Monitoring for visibility into the health of your applications and Google Cloud services, Cloud Logging for real-time log management, and application-level diagnostic tools such as Trace and Profiler to reduce the latency and cost of your services.
In this chapter, we will also learn how to estimate costs in Google Cloud.
We are going to cover the following main topics:
- Monitoring
- Logging
- Diagnostics
- Estimating costs with Google Cloud Pricing Calculator
As a beginner, learning about monitoring and logging can be difficult since you usually need a deployed real-life application to access more interesting statistics and logs. If you’re up for a challenge, you can try following the steps in the Getting started with Python documentation (check the following link) and deploy a real-life web application called Bookshelf. This application uses Cloud Run and Google Cloud Storage and can be accessed from the internet, giving you the chance to collect some interesting logs and metrics: https://cloud.google.com/python/docs/getting-started.
If you have ever worked as an on-premises system administrator, you have probably physically inspected or logged in to your server’s management console in response to various alerts that have fired in your monitoring console. For example, a fan or a disk failure, a power outage, or a network port flap can happen in any data center and can be easily detected thanks to monitoring systems.
Although moving to Google Cloud means you don’t have to monitor the underlying network and physical infrastructure anymore, you are still responsible for your applications in a similar way as you were responsible for them on-premises.
Google offers a highly efficient service called Cloud Monitoring, which is avaiable by default once you create your project. This service provides many tools for collecting, analyzing, and presenting real-time monitoring data for both Google Cloud services and user workloads. Most Google Cloud services are already connected to the monitoring system when you set them up and start using them. Cloud Monitoring is not limited to Google Cloud; it can also be used to collect metrics from other solution providers, such as those available on-premises or on AWS. This makes it a versatile tool for monitoring hybrid-cloud environments.
If you plan to have multiple Google Cloud projects and on-premises workloads, you might assume you must log in to various places to monitor everything. However, that is not the case. Instead, you can create a dedicated monitoring project to gather data from the entire setup and view it all in one place. To expand the scope of your metrics, use the + ADD GCP PROJECTS option to include other projects in your monitoring project. Refer to the accompanying screenshot for guidance:
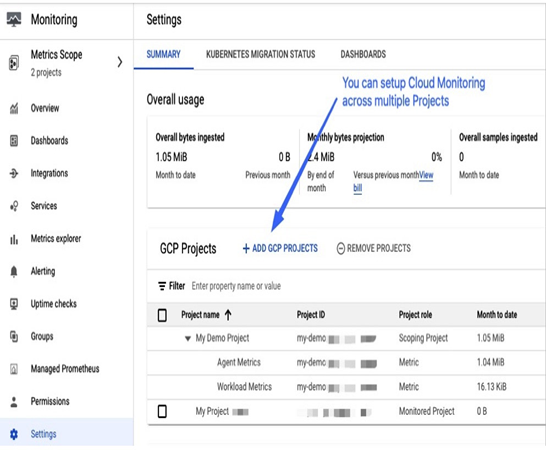
Figure 11.1 – Increasing the monitoring scope by adding more projects to Cloud Monitoring
An excellent way to start learning about Cloud Monitoring is by exploring what your service’s default dashboards can offer and creating your personalized dashboards in the next step. For example, if you create a Compute Engine VM or start using Google Cloud Storage or GKE, a service-specific dashboard will be added in the Dashboards section under the GCP category, as shown in the following screenshot. This is the section where you can start discovering the default metrics:
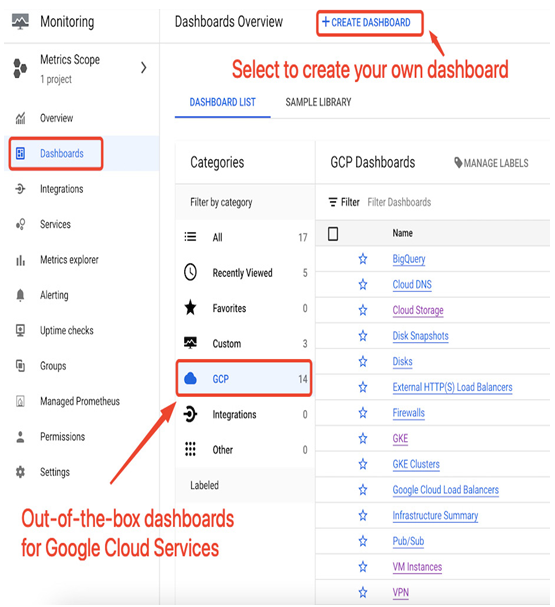
Figure 11.2 – Default dashboards for GCP services
To help you easily understand what can be monitored without any extra setup, here is a table showing some Google Cloud services and their corresponding pre-built metric parameters:
| Service | Selected out-of-the-box metrics |
| Compute Engine VM | CPU utilization, network traffic, disk operations, and uptime |
| Google Cloud Storage | Number of requests per bucket, network traffic sent/received per bucket, total number of objects stored in a bucket, and size of the objects |
| GKE | Container restarts, CPU utilization, and memory utilization |
| Cloud Run | Container CPU utilization, container memory utilization, request count, request latencies, sent bytes, and received bytes |
Table 11.1 – Examples of pre-build metrics for selected Google Cloud workloads