Configure diagnostic settings
While the resources you deploy in Azure create metrics automatically, many of them also offer richer diagnostics logs, which can be configured to send their log data to another location, such as a storage account or a Log Analytics workspace. In addition to resource logs, there are also tenant-level services, such as Microsoft Entra ID, which exist outside a subscription from which you might need to collect log data.
Diagnostics logs are one type of log data. There is also log data within the Azure activity log, and there is log data that can be obtained from virtual machines with the use of diagnos- tics agents that is separate from diagnostic logs associated with a tenant-level service or an Azure resource. It is important to understand the differences between the types of log data that are available and where that log data can be stored.

The Azure activity log surfaces data at the subscription level and can be useful for under- standing actions that occur within your environment against the ARM APIs. For example, when a new deployment is submitted, the events associated with that deployment—such as the time it was submitted, the resources that were created, and the user that submitted the request— are all tracked within the activity log. However, at the subscription level, you are missing any resource-level logs. For example, the activity log can show when a network security group (or NSG) was created, but it cannot show when an NSG rule was applied to traffic that was subject to the NSG, such as when a port or protocol is blocked. Diagnostic logs provide this functionality.

Diagnostic logs will need to be enabled for each resource from which you want to collect additional telemetry. Note that metrics are resource-specific and captured automatically, so you only need to enable diagnostic logs to capture log data or to send metrics to another service.

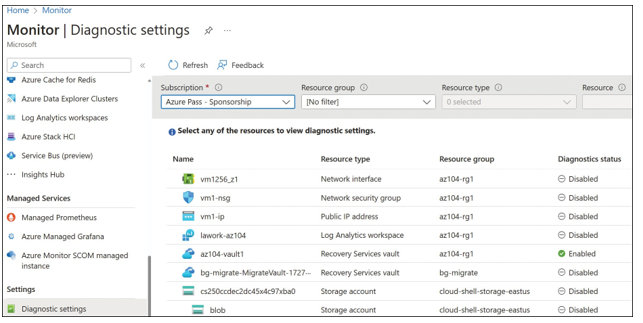
To enable diagnostic logs through the Azure portal, you can browse to the resource itself to create the settings. The alternative and recommended method is to browse to the Azure Moni- tor Diagnostic Settings blade. From this blade, you can view all the resource types eligible for diagnostic logs and view the status (enabled or disabled) for log collection on each resource. Also, you can filter by subscription, resource group, resource type, and resource. An example is shown in Figure 5-13.

FIGURE 5-13 Azure Monitor Diagnostic settings
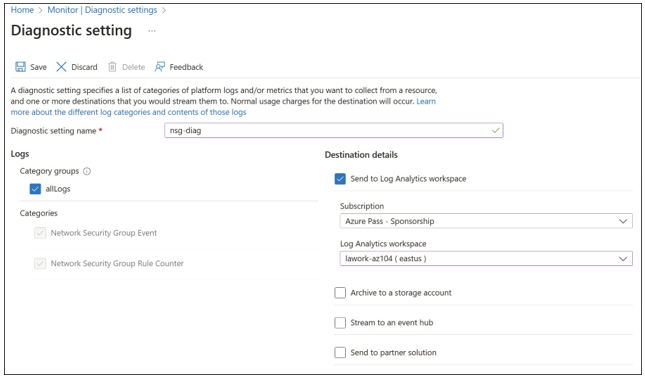
To enable diagnostic settings, click a resource with a status of Disabled. On the Diagnostic Settings blade, click Add Diagnostic Setting. Specify the Diagnostic Setting Name and select the required logs, as shown in Figure 5-14.

FIGURE 5-14 Azure Monitor diagnostic settings for a resource

When configuring diagnostic settings, you select where the logs (and optionally metrics) are sent. You can choose from these valid locations to send data to: Archive To A Storage Account, Stream To An Event Hub, or Send To Log Analytics (see Figure 5-14). As you select each loca- tion, additional configuration will be required. For example, to archive to a storage account, you will need to select an existing storage account or create a new storage account.
For diagnostic logs that support retention with storage, you can select a retention period in days. A retention period of zero days means the logs will be retained forever. Any number between 1 and 365 is valid for the number of days. If you set the retention period and have only selected an Event Hub or a Log Analytics workspace (but have not selected a storage account), the retention settings will be ignored.
As you configure each resource or service, you can send the data from multiple log sources to the same destination. For example, you can send the diagnostic logs from a tenant service like Microsoft Entra ID to a Log Analytics workspace, and you can send the diagnostic logs from a resource like a Network Security Group to the same Log Analytics workspace.
It can take several moments for the setting to appear in the list of settings for the resource. Note that even though the setting has been configured, diagnostic data will not be collected until a new event is generated.
All these settings can be configured through the Azure portal, Azure PowerShell, the Azure CLI, or through the Azure Monitor REST API.
EXAM TIP
The Azure Diagnostics extension can also be configured through resource manager templates and the command-line tools by specifying a configuration file. For the exam, you should be aware of the schema of this configuration and how to apply it using automated tools. You can learn more about the Azure Diagnostics schema at https://learn.microsoft. com/azure/azure-monitor/agents/diagnostics-extension-versions.
