In addition to monitoring native GCP services and operating systems of your VMs (via Ops Agent), Cloud Monitoring provides you with options to closely monitor your applications. If your application runs on a Compute Engine VM and is listed as a supported third-party application in the Google Cloud Monitoring documentation (https://cloud.google.com/monitoring/agent/ops-agent/third-party), you can leverage Ops Agent to monitor it. For example, Ops Agent supports nginx (a web server app) integration to collect connection metrics and access logs. If your VM has Ops Agent installed and you follow the Ops Agent nginx configuration instructions published on the aforementioned URL, Cloud Monitoring will start ingesting new metrics related to web server traffic.
The following screenshot shows the Dashboard list section with an Integration Dashboards category in which Nginx Overview was added automatically after the Ops Agent configuration:
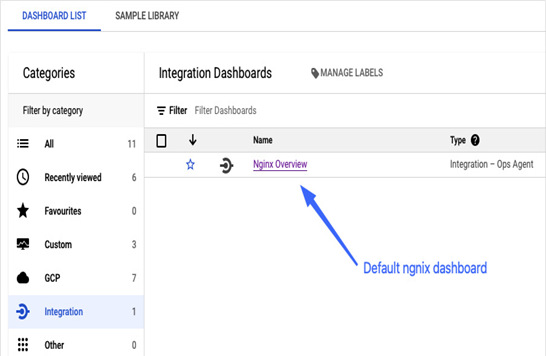
Figure 11.14 – Once the nginx service is detected, a new dedicated dashboard is shown under the Integration section
If you look for more customized dashboards for your nginx service, you can set them up the same way we do later in the Custom metrics section. VM Instance metrics will have new additional nginx-related metrics such as Nginx request count.

Figure 11.15 – Metrics available for nginx
The following is an example of a customized dashboard built using dedicated nginx metrics:
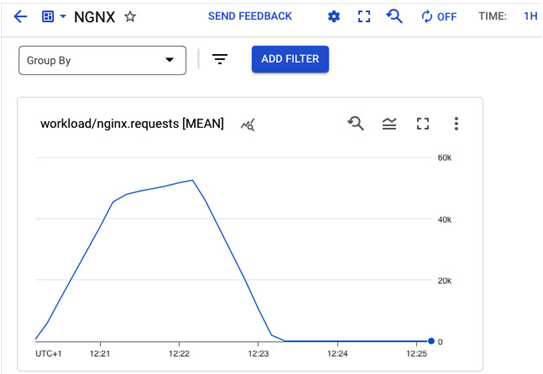
Figure 11.16 – Example dashboard with nginx requests
It shows the number of incoming requests that can be tracked thanks to the nginx-specific Ops Agent configuration. Similarly, we can leverage dedicated metrics for all other supported third-party applications.
What if your application doesn’t run inside a Compute Engine VM, built-in metrics don’t collect what you need, or a more customized approach to monitoring your app is required? For such scenarios, Google Cloud provides custom metrics and log-based metrics.
Custom metrics
Suppose you want to collect application-specific metrics that the built-in Cloud Monitoring doesn’t offer. In that case, you can capture those by using the client library for the monitoring APIs directly in your code and send the metrics to Cloud Monitoring. It is the lowest possible layer at which you can control and collect data. The downside to this approach is that you will have to manage the entire setup in your code.
The alternative would be to use the OpenCensus metrics instrumentation library to define custom metrics. It is an open source framework for collecting metrics used in Google Cloud as a default ingestion mechanism. If you don’t want to use instrumentation libraries, there is another possibility – to use Google Cloud Managed Service for Prometheus. Prometheus is a standard for monitoring in the open source ecosystem and offers a wide range of system integrations in multi-cloud environments. In Google Cloud, it can be used to monitor Kubernetes and VM workloads.