Query and analyze logs in Azure Monitor
As mentioned earlier, Azure Monitor stores and surfaces two types of data: metrics and logs. Metrics are numerical values such as performance counters, whereas logs can be either numerical data or text. For instance, the full text of an exception that is raised in an application or even the text of an application log from a Windows or Linux server is one example.
Create a query
After the workspace has been configured, and tenant logs, resource logs, and machines have been onboarded, you can begin to analyze and visualize data. To interact with the data in Log Analytics, you use log queries, which are used to
- Perform interactive analysis of log data through the Azure portal in Azure Monitor and a Log Analytics workspace
- Build custom alert rules based on the logs in a workspace
- Generate visualizations that can be shared through Azure dashboards
- Export custom data sets to Excel or Power BI
- Perform automation based on log data with PowerShell or the Azure CLI

The query language used by Log Analytics is called Kusto Query Language (KQL). KQL que- ries are used to generate read-only requests to process data and return results. This means that the logs stored in Log Analytics are immutable and are only removed from a workspace based on the retention configuration. Queries are authored in plain text, and the schema used by Log Analytics is like that used by SQL, with databases and tables composed of columns and rows. In each table, data is organized in columns with different data types, as indicated by icons next to the column name. Column data types include text, numbers, and datetime.
Authored queries in Log Analytics can take many forms, from basic queries to very advanced queries with multiple aggregates and summarizations. Queries can be used to search terms, identify trends, analyze patterns, and provide many other insights. Queries search tables; they can start with either a table name or a search command that defines scope. The pipe (|) character separates commands, and you can add as many commands as required.
In the following example, the Heartbeat table is queried to summarize the count of computers (by IP) and by a time value (TimeGenerated) to render a chart that tracks the number of computers reporting a workspace each hour.
// Chart the number of reporting computers each hour Heartbeat
| summarize dcount(ComputerIP) by bin(TimeGenerated, 1h)
| render timechart
To run this query, browse to Azure Monitor and click Logs to open the query interface. This query will not return data if you do not have any virtual machines deployed and running. Those machines must also be associated with the Log Analytics workspace you are querying.
The preceding query is a table-based query. Queries always begin with a scope—either a table or search-based query. Kusto queries are case-sensitive. Typically, language keywords are written in lowercase. When using the names of tables and columns in queries, ensure you are using the correct case. Table-based queries target a single table in a Log Analytics workspace (or database), while search-based queries target all tables by default.
Table-based queries start by scoping the query, and therefore tend to be very efficient and generally faster than search queries. Search queries are less structured by nature, which makes them the better choice when searching for a specific value across columns or tables. In other words, a search can scan all columns in one table or in all tables across an entire workspace for the defined value.
The amount of data being processed by a query could be enormous, which is why these queries can take longer to complete and might return large result sets that are limited by the Log Analytics service to 10,000 results.
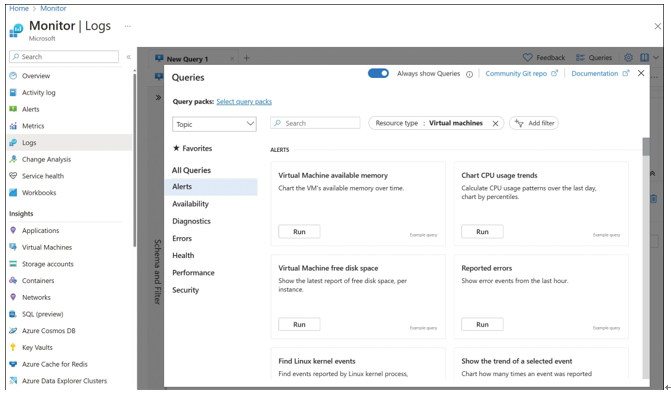
To author queries in the Azure portal, browse to Azure Monitor, and open the Logs blade. From this blade, you can access all the subscriptions and workspaces you have rights to read from. Azure Monitor offers many sample queries for heartbeats, performance, and usage across your machines and services tracked in Log Analytics (see Figure 5-15).

FIGURE 5-15 Azure Monitor logs
Select a query and click Load To Editor to open an editor with query preview, as shown in Figure 5-16.

FIGURE 5-16 Query editor with sample query
