Subscribing to a dashboard
Dashboards are not refreshed every time we open them; that’s the reason behind the refresh button.
Like reports, we can enable users to subscribe to the dashboard to refresh them automatically and receive the results by mail. We can create a daily recap of the status of the call center (unclosed cases, escalated cases, expiring SLAs, and so on) or a weekly review of ongoing deals.
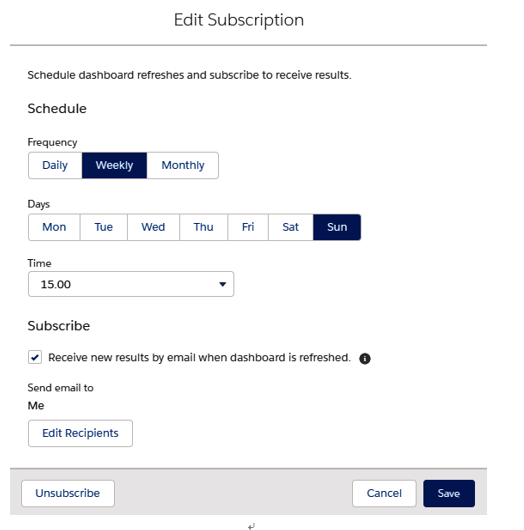
Click the Subscribe button on the top header of a dashboard to enable a subscription; the following modal shows up:

Subscription to a dashboard
We can subscribe to up to five dashboards and refresh on a daily, weekly, or monthly basis. It is possible to subscribe to our own user or other users, groups, or roles, but the dashboard must be placed inside a non-private folder (otherwise the Edit Recipients button will not be shown). The kind of entities you can subscribe to (users, roles or groups) depends on the folder sharing settings (which we’ll see in the next few section).
Filters aren’t applied when you schedule or email a dashboard. You can’t schedule subscriptions for dynamic dashboards: they must be refreshed manually.
Limitations with dashboards
One of the most important limitations when dealing with dashboards is that they don’t support localization, which means you cannot translate report names, filter names, or component descriptions. Take this into account when developing a multilanguage org.
Many of the limitations have already been described in the previous sections, but some (or all) of them may be upgraded on the next Salesforce releases.
For an up-to-date and detailed list of all limits that apply to dashboards and reports, refer to Salesforce Help at https://help.salesforce.com/articleView?id=rd_dashboards_limits.htm&type=5.
For an up-to-date and detailed list of unsupported reports and dashboard differences between Classic and Lightning Experience, refer to Salesforce Help at https://help.salesforce.com/articleView?id=lex_gaps_limitations_analytics.htm&type=5.
Summary
In this chapter, we have reached the end of our discussion regarding reports and dashboards. We learned everything there is to know about creating useful dashboards and reports in a way that enables your users to see how a business is going at a glance. By building new dashboards, you can create an engaging and effective view of what’s happening in your org and highlight any issues in your processes’ data, giving a quick overview for you to highlight pertinent information and execute the right actions to improve your business. We’ve seen how dashboards can be organized into folders, to limit users level of access, how they are created and configured, how reports can be charted using components, how dashboards are filtered and how users can subscribe to dashboards to get scheduled notifications upon data refresh.
In the next chapter we’ll look at how to enhance our business processes using process automation features. They provide more complex data flows within our CRM and automate complex data model needs, allowing our agents to solve custom issues rather than lose time creating or updating related records one after the other, making our data even more coherent with business needs.
