Troubleshoot network connectivity
Azure provides several built-in tools to troubleshoot network connectivity, with most of them available through Network Watcher. This section focuses on two of the tools within Network Watcher that can help you troubleshoot network connectivity.
Connection Troubleshoot
Connection Troubleshoot is a Network Watcher feature designed to test the connectivity between an Azure VM or an App Gateway and another endpoint—either another Azure VM, or an arbitrary internet or intranet endpoint. This diagnostic tool can identify a range of prob- lems, including guest VM issues, such as guest firewall configuration, low memory, or high CPU; Azure configuration issues such as network security groups blocking traffic; or routing issues diverting traffic. It can also diagnose other network issues, such as DNS failures.
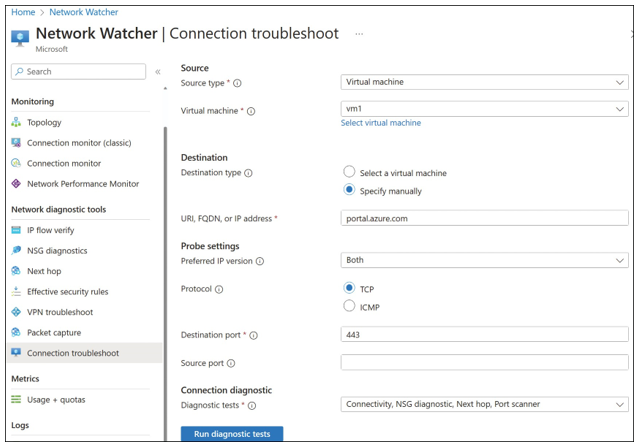
To use Connection Troubleshoot from the Azure portal, open Network Watcher, and then click Connection Troubleshoot. Specify the source VM, then specify the destination, either as another VM or by giving a URI, FQDN, or IPv4 address. Specify the protocol to use (either TCP or ICMP). For TCP, you can specify the destination port, and, under Advanced Settings, the source port. An example configuration is shown in Figure 4-19.

FIGURE 4-19 Network Watcher Connection Troubleshoot configuration
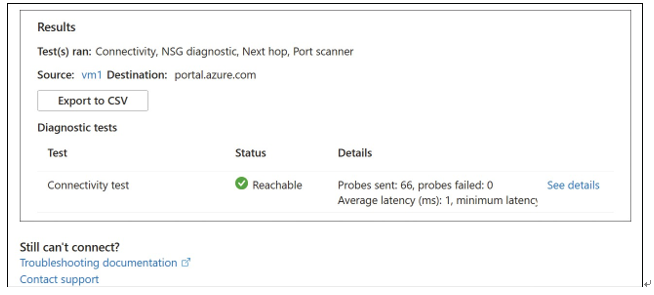
The test takes a few minutes to run. Upon completion, the results will be shown at the bottom of the page. An example output is shown in Figure 4-20.

FIGURE 4-20 Network Watcher Connection Troubleshoot results
Connection Troubleshoot is also available via PowerShell using the Test-AzNetwork- WatcherConnectivity cmdlet and via the Azure CLI using the Azure Network Watcher az network watcher test-connectivity command.
Connection Monitor
The Connection Monitor in Network Watcher is similar to Connection Troubleshoot in that it uses the same mechanism to test the connection between an Azure VM or App Gateway and another endpoint. The difference is that Connection Monitor provides ongoing connection monitoring, whereas Connection Troubleshoot provides only a point-in-time test.
Data from Connection Monitor is surfaced in Azure Monitor. Charts show key metrics such as round-trip time and probe failures. Azure Monitor can also be used to configure alerts, triggered by connection failures or a drop in performance.
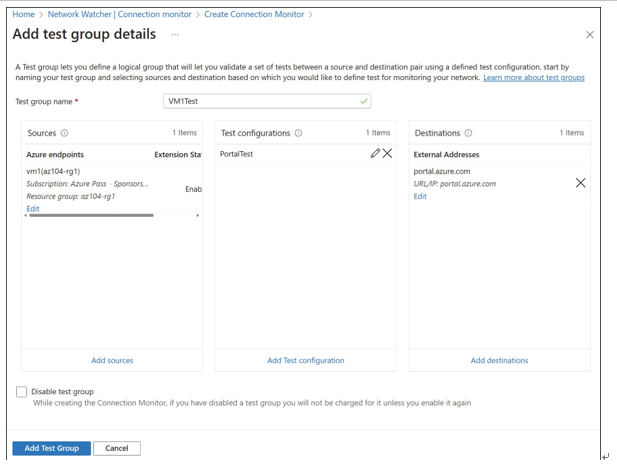
To use Connection Monitor via the Azure portal, open Network Watcher and click Con- nection Monitor. A list of active monitored connections is shown. Click Create to create a new monitored connection and then fill in the connection settings. The settings are almost the same as for Connection Troubleshoot. Also, you will need to specify the probing interval in seconds. An example is shown in Figure 4-21.
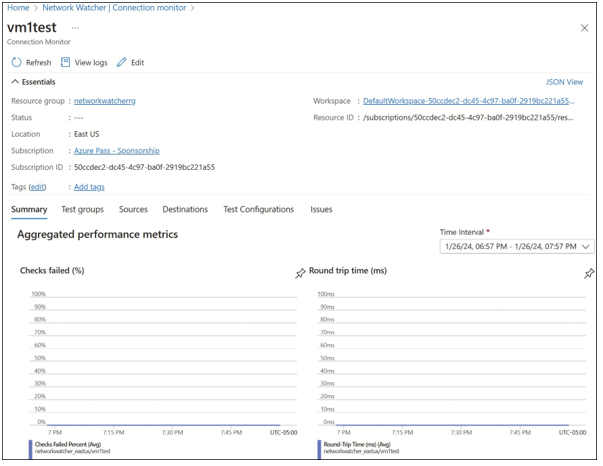
The monitored connection will be listed on the Connection Monitor blade within Network Watcher. Click a monitored connection to open the results panel, as shown in Figure 4-22. The chart shows average round-trip time and the percentage of probe failures. Click the chart to view the data in Azure Monitor. From there, you can configure alerts based on these metrics exceeding thresholds you define. The table below the chart shows the current connection status; clicking each line provides further details about the status, which is similar to how Connection Troubleshoot results are shown.

FIGURE 4-21 Network Watcher Connection Monitor configuration

FIGURE 4-22 Network Watcher Connection Monitor status
