Filtering dashboards
Before talking about filtering a dashboard, let’s see the previous dashboard from the Save As action. Create a new Sales Amazing Dashboard, which will cover only opportunity-related stuff (I’ve added a simple metric component that shows the number of opportunities for the current year):
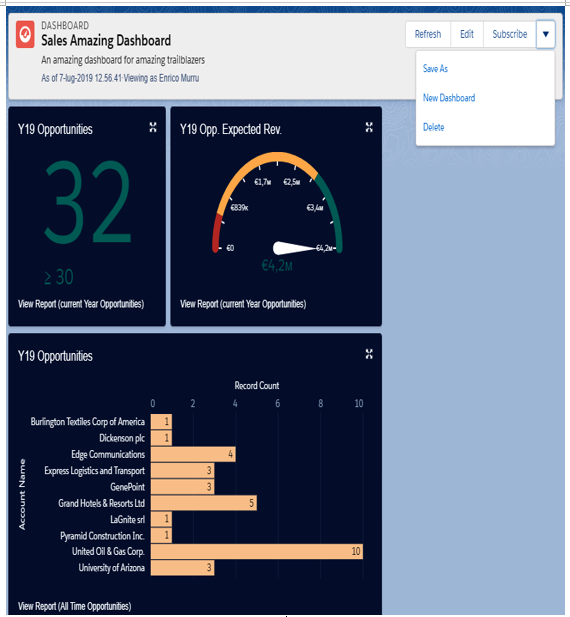
Dashboard created by cloning another dashboard using the Save As action
This feature is very useful because it allows us to create a new dashboard without starting from scratch.
Now click Edit on this new dashboard and then the + Filter button to create a new filter:
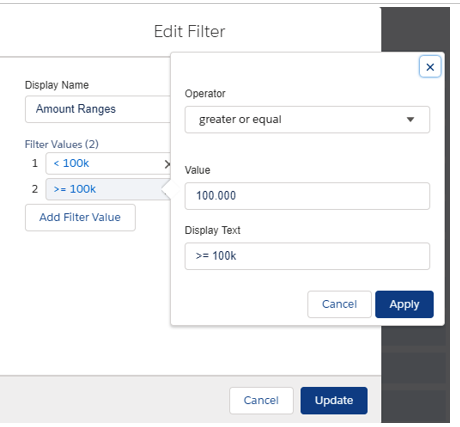
Adding a dashboard filter on a currency field
This filter is based on the Amount field and supports two different values:
- Amount >= 100k
- Amount < 100k
We can create another filter on opportunity stages:
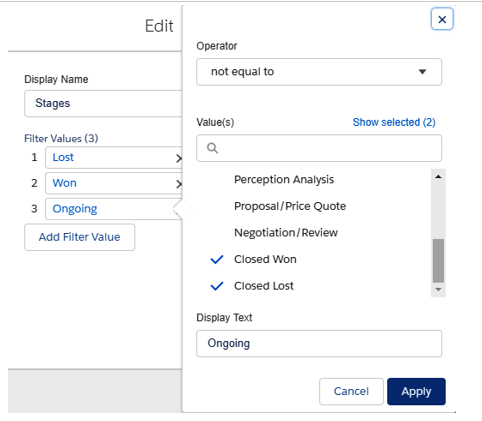
Adding a dashboard filter on a picklist field
This filter filters out the following:
- Lost opportunities
- Won opportunities
- Any other opportunity (opportunities whose stage name is not equal to Closed Lost or Closed Won)
Once you save the filter, you get a nice filter header at the top of your dashboard where anyone can filter out the results. The following screenshots show how a filter can alter the overall dashboard charts
- Given the dashboard is without any filter:
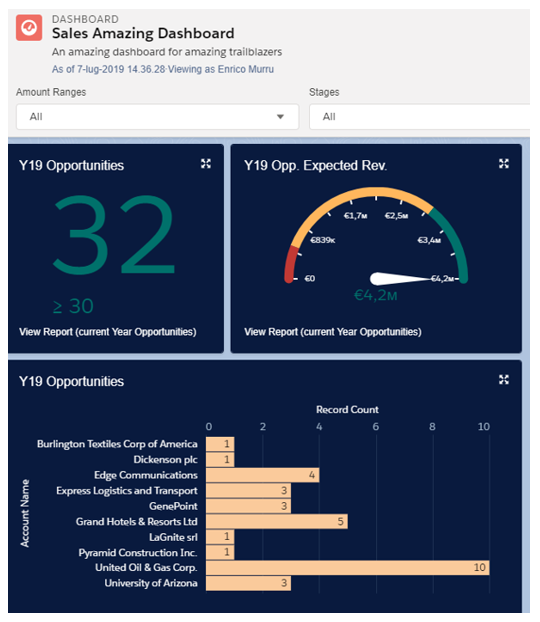
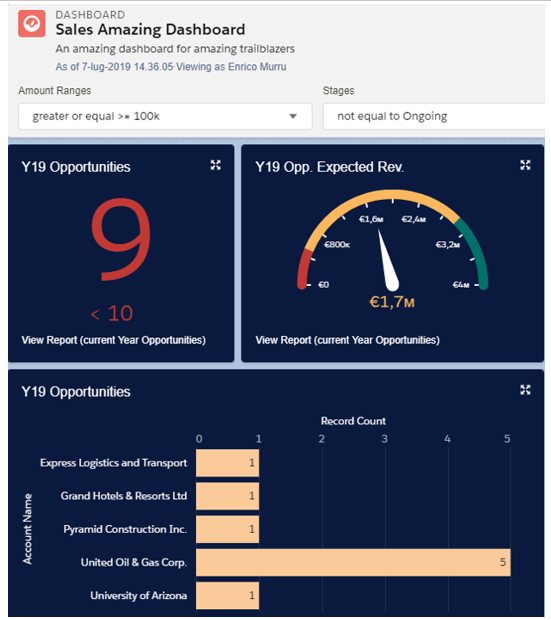
- By applying a filter on Amounts greater or equal then $100k and Stages not equal to “Ongoing” the dashboard instantly updates all the charts:
- Adding another kind of filters for Amounts less then $ 100k but with “Won” stages we can see that the dashboards changes again:
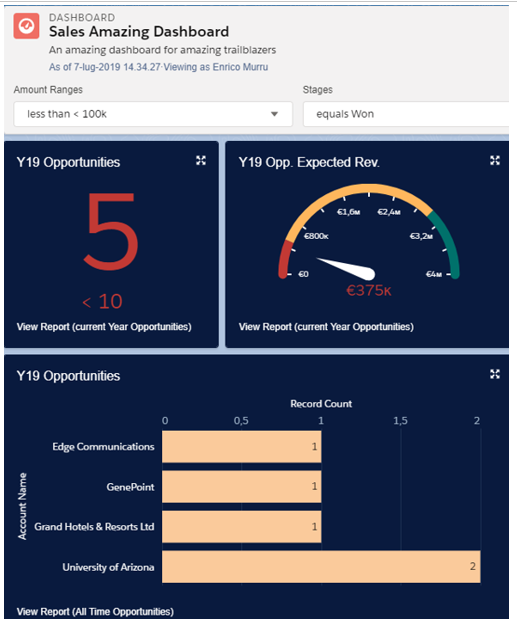
Example of the dashboard filters application
Setting up the right filters will give your users the right way to inspect insights on their org dashboards.
When selecting a field on the filter editing panel, the dashboard editor gives you a dropdown with all the fields that are common to all the reports inside the dashboard.
If you add components within a dashboard that are coming from unrelated objects, you can get an awful error message if filters are already set up that are not usable within the new component. The error message states that The component can’t be displayed because the field(s) you chose for the filter are unavailable. Either remove the filter or the component.
Filters can be made out of picklists, lookups, and checkboxes using text, numeric, and date/datetime fields, and each filter can have up to 50 values (as of summer 2019). Filters cannot be made out of summary formulas or bucket fields.
When a filter is changed, it can take few seconds for the refresh operation to happen, and cached data is used. If you don’t see the expected results, click the Refresh button (you can click it once every 60 seconds) or refresh the page.
The filter application is cached, so every time you run a dashboard, you get all of the previously selected filters.
Another interesting feature about filters is that we can click on chart segments to view the details of that segment on a report format, filtered by the aggregation of dashboard filters and segment filters:
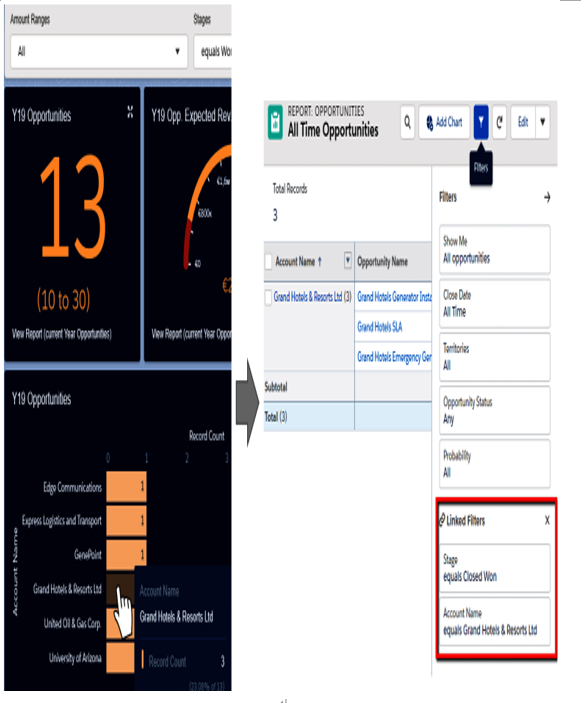
Viewing segment details on a filtered report
The Filters button on the report page shows all of the filters applied to the current report’s view. To open the report details from the dashboard on a new tab, hold down Ctrl/cmd and left-click the mouse.
